Welcome to the My Kanji Blog
Kanji Is an Information Technology
The character 鬱 (depression) encodes in one glyph what English spells out in ten letters and 29 strokes. That is not calligraphic trivia. It is an engineering fact about one of the oldest information-encoding systems still in daily production use -- a system that has been continuously deployed for over 3,000 years and currently serves as the primary script for 1.5 billion people.
This blog exists to examine kanji at the level they deserve: as an information technology with measurable properties, not a cultural curiosity.
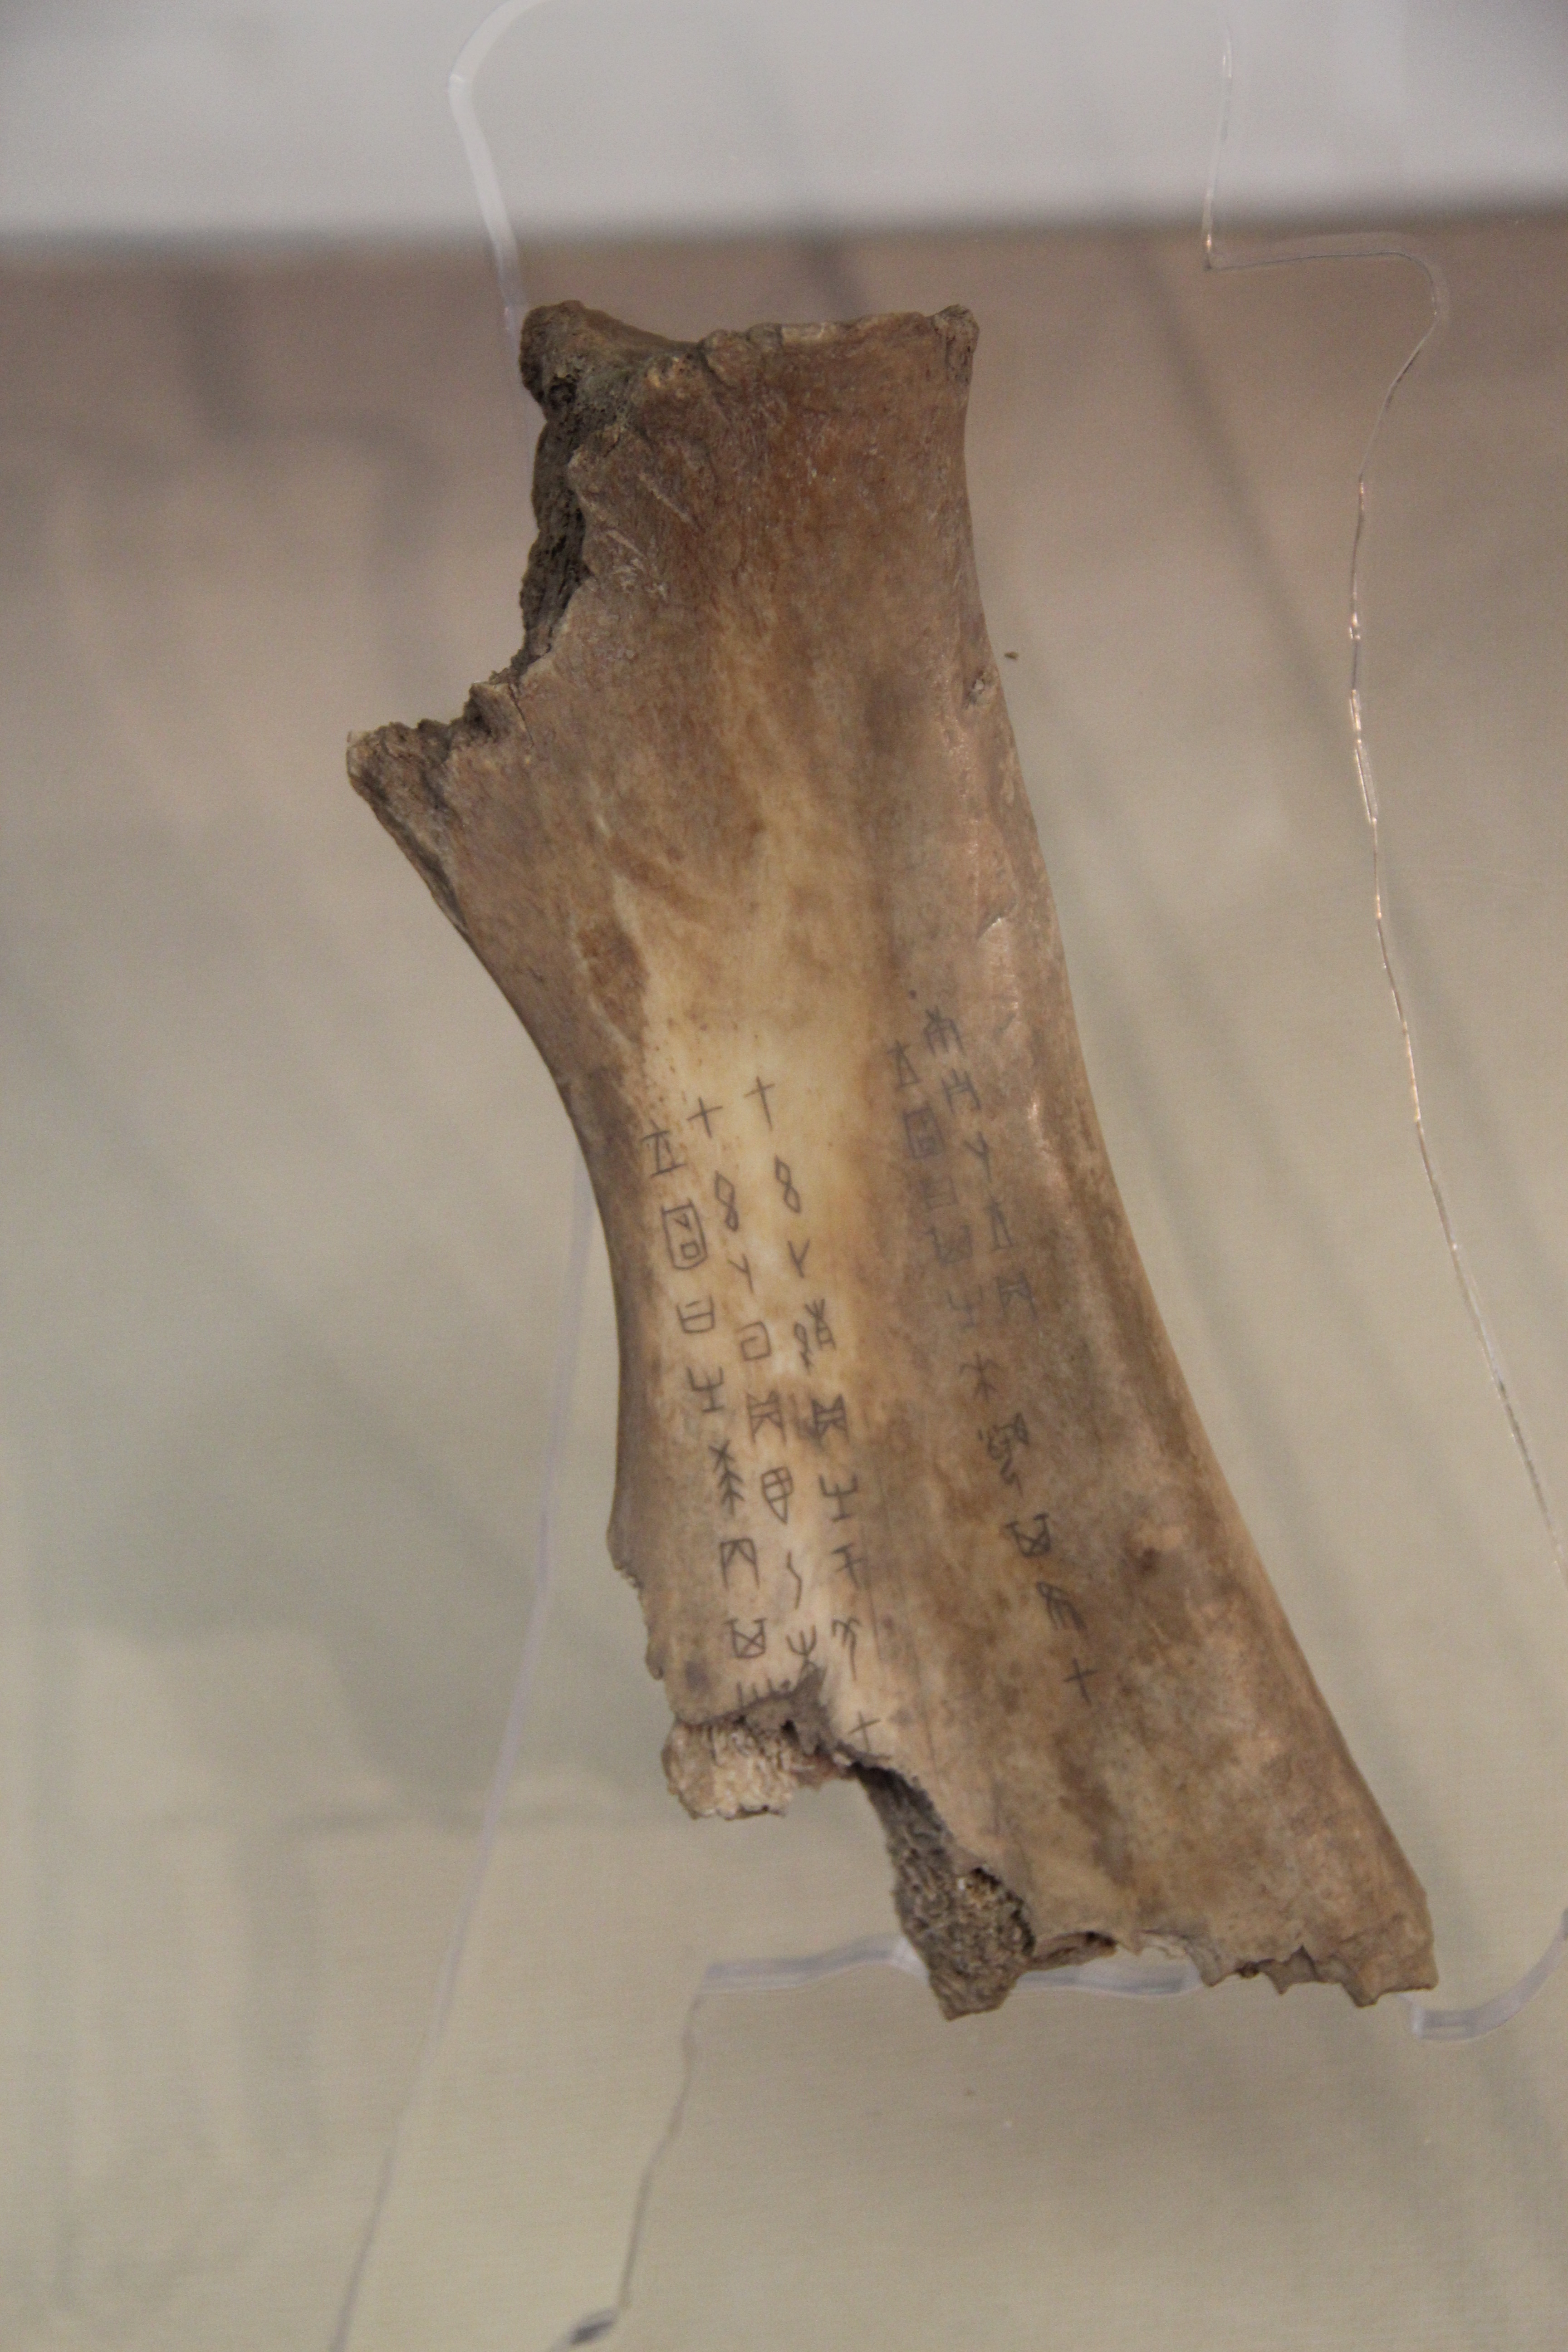
Ox scapula bearing oracle bone script (甲骨文) from the late Shang dynasty, excavated at Yinxu (Anyang). The earliest direct ancestor of modern kanji, dated c. 1250–1050 BCE. Source: Wikimedia Commons.
The Compression Argument
Shannon entropy quantifies information content per symbol. English letters carry roughly 4.0 bits each. Chinese characters carry approximately 9.56 bits -- 2.4x more information per glyph (Cook, 2019). The practical consequence: CJK text is shorter. Mark Liberman's analysis at Language Log found English text runs 27--45% longer than equivalent Chinese, depending on the corpus.
But here is the deeper finding. Coupe et al. (2019) measured speech across 17 languages in Science Advances and found they all converge on the same information rate: approximately 39 bits per second. Japanese speakers produce ~8.0 syllables per second (among the fastest measured), but each syllable carries less information. English speakers are slower at ~6.2 syllables per second, but each syllable is denser. The channel capacity is fixed by human cognition; the encoding varies.
| Language | Syllables/sec | Bits/syllable | Bits/sec | Script |
|---|---|---|---|---|
| Japanese | 8.0 | ~5 | ~39 | Logographic + syllabic |
| English | 6.2 | ~7 | ~39 | Alphabetic |
| Vietnamese | 5.3 | ~8 | ~39 | Alphabetic (tonal) |
| Spanish | 7.7 | ~5 | ~39 | Alphabetic |
Source: Coupe et al. (2019), Science Advances, 17 languages, 170 speakers
The encoding is different. The throughput is the same.
The Zipf Distribution: Extreme Leverage
Kanji frequency follows a power law. Chikamatsu et al. (2000) analyzed a full year of the Mainichi Shimbun -- 23 million kanji tokens -- and the cumulative coverage curve is strikingly steep:
| Kanji Known | Cumulative Coverage | What This Gets You |
|---|---|---|
| 100 | ~45% | Basic signs, children's books |
| 500 | ~80% | Everyday text, simple articles |
| 777 | ~90% | General newspaper reading |
| 1,000 | ~96% | Comfortable fluency threshold |
| 1,600 | ~99% | Near-complete coverage |
| 2,136 (Joyo) | ~99.9% | Official literacy standard |
Five hundred characters cover 80% of newspaper text. The top 0.5% of the character space handles the vast majority of written communication. No alphabetic system exhibits this kind of leverage -- the closest analogy is how a handful of assembly instructions account for most executed code.

Zipf-law plot (frequency as a function of frequency rank, log-log) for three East Asian languages. The Chinese curve uses Dream of the Red Chamber (2,420 distinct characters). The near-linear slope on log-log axes is the visual signature of the power law that produces the 80% / 500-character coverage figure above. Source: Wikimedia Commons.
Two Brains, One Reader
Kanji are not just informationally dense. They are neurologically distinct. fMRI studies (Yokoyama et al., 2006; Nakamura et al., 2005) reveal that reading kanji activates bilateral occipitotemporal regions -- recruiting the right hemisphere's visuospatial pattern-recognition circuits alongside the left hemisphere's language areas. Alphabetic and syllabic scripts (including Japanese kana) lateralize predominantly to the left hemisphere for phonological decoding.
The mechanism is a dual-route architecture: kanji engage the ventral pathway (V1 to ventral occipitotemporal cortex to Broca's area) for direct visual-to-semantic mapping, while kana and alphabetic text use the dorsal pathway (V1 to supramarginal gyrus to Broca's area) for phonological recoding. Your brain literally processes 漢 and "kanji" through different neural circuits.
The reading consequence: English readers perceive 7--8 letters per eye fixation; Chinese readers perceive only 2.6 characters (Sun, Morita & Stark, 1985). Yet both read at comparable speeds -- roughly 380 words per minute equivalent -- because each Chinese character delivers more information per fixation.
Why This Blog
My Kanji is built for people who see 2,136 characters not as an obstacle but as an information system worth understanding on its own terms. This blog will cover frequency analysis, component architecture, etymology, cognitive science of character recognition, and the computational properties of logographic writing. Browse the kanji index, the 214 Kangxi radicals, or start studying by grade.
Every post will contain data. If a claim cannot be cited, it will not appear here.
References
- Chikamatsu, N., Yokoyama, S., Nozaki, H., Long, E., & Fukuda, S. (2000). A Japanese logographic character frequency list for cognitive science research. Behavior Research Methods, Instruments, & Computers, 32(3), 482--500.
- Cook, J.D. (2019). Chinese character frequency and entropy. johndcook.com.
- Coupe, C., Oh, Y.M., Dediu, D., & Pellegrino, F. (2019). Different languages, similar encoding efficiency. Science Advances, 5(9).
- Liberman, M. (2008). Is English more efficient than Chinese after all? Language Log, UPenn.
- Nakamura, K., Dehaene, S., Jobert, A., Le Bihan, D., & Kouider, S. (2005). Subliminal convergence of Kanji and Kana words. Journal of Cognitive Neuroscience, 17(6), 954--968.
- Sun, F., Morita, M., & Stark, L.W. (1985). Comparative patterns of reading eye movement in Chinese and English. Perception & Psychophysics, 37(6), 502--506.
- Yokoyama, S., et al. (2006). Cortical activation in the processing of passive sentences in L1 and L2. Brain and Language, 98(3), 233--241.